31 Mar 1. Create reports for typical project
CP-Reports help you to present project critical data in MS Excel Pivot Tables, Charts and MS Power BI views. .xlsx and .pbix files are created according to settings in designer and templates selected. These files are well-functional in terms of ‘slicing’, ‘dicing’, filtering, representation and other BI features and self-sufficient compare to standard MS Project reports.
Create Standard Report
- Click
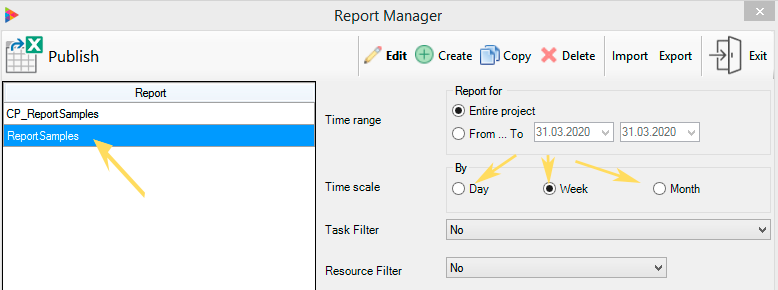
 ‘ on ‘CP-Tools’ ribbon tab. Report manager is opened,
 - Select ‘ReportSample’ from list. If there is no ‘ReportSample’, please click Start Page on ‘CP-Construction’ tab and ‘Load Demo-project’ to get ReportSample copied,
- Select appropriate time scale – minimal time period to do drill down of timephased data.
- Click ‘Publish’ and wait while Excel opens and refreshes data.
- Power BI report has been also generated but not opened automatically. You can find one in the same folder and name as Excel report. Folder path is shown at bottom left corner as ‘Report Publish.Path’
NOTE: Do not forget to set project start date before earlier project task. Tasks before project start date do not come into report.
Create your OWN Report
The best way to create own report is to modify standard ‘ReportSample’. There are 3 steps below to achieve almost anything you want but usually first step is enough.
1. Modifying Excel\PowerBI template of ‘ReportSample’
Theory
‘ReportSample’ extract most useful data from your project and fill hidden RawData worksheet in Excel template and SourceDataTable in PowerBI template. Then Excel PowerPivot gear comes on scene and generates so called ‘measures’ and ‘dimensions’ which help slicing, dicing, filtering, grouping e.t.c. of project data in Pivot Tables, Charts and other visualizations. These visualizations fill other Excel worksheets.
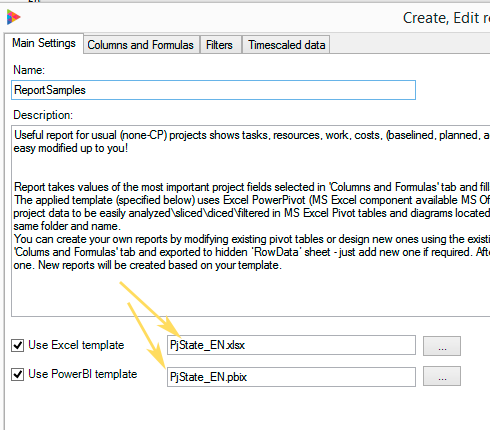
Practically, it means that you can modify generated Excel\PowerBI report by deleting\editing any worksheets (except ‘RawData’), Pivots and Charts, structure and design. Then save and substitute original PjState_EN.xlsx template (see slide on the right) with new one just created. Now new reports will be generated as designed in new template.
Practice
- Publish ‘ReportSample’ report for your project
- Edit report as you need.
- Save edited report with new name.
- Copy saved report into ‘ExForms Templates’ folder. This folder is in Construction Project root folder.
- For Power BI reports only -> change data source to non-existed file for report copied.
- Open report in Power BI desktop,
- Select ‘Transform Data’ – > ‘Edit Parameters’. Parameter window appears.
- Replace existing value in ‘Excel file’ with any (for example 1.xlsx) and click OK.
- Save report without applying changes (Select ‘Apply later’ when asked)
- Select copied template in ‘ReportSample’ configuration.
NOTE; At the beginning we recommend to make a copy of ‘ReportSample’ by clicking ‘Copy’ on top menu in Report designer and proceed the above with copy.
2. Modifying Excel\PowerBI template to add columns to ‘ReportSample’
Theory
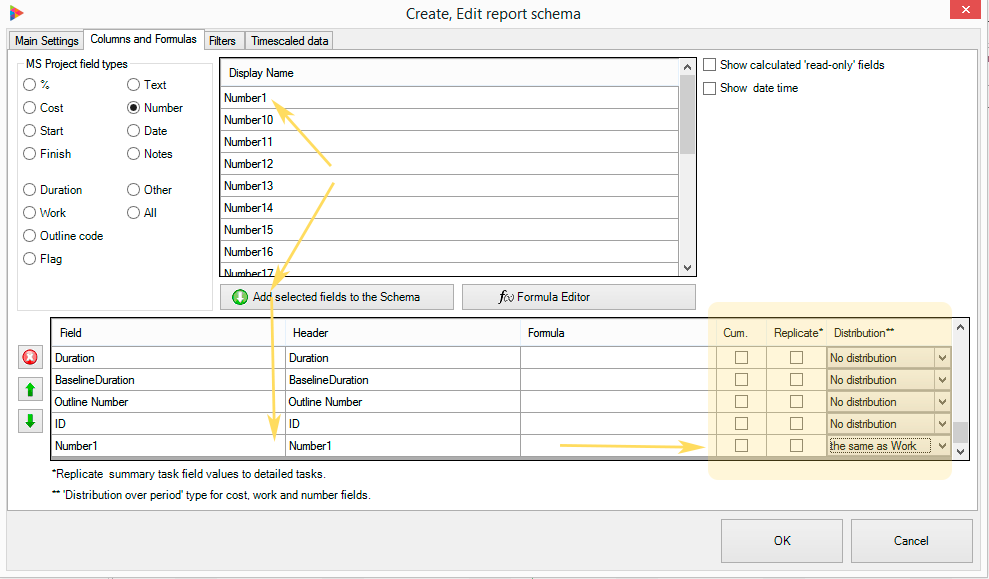
If other MS Project fields (number, text, date e.t.c) are required in report you may add ones using ‘Column and Formulas’ tabs in Report Designer. On right slide Number1 has been added to field set extracted to report. The Feature is (for Number and Cost fields) – You may distribute field value over the time exactly the same as work distributed over time. It is not possible in MS Project but sometimes needed in real projects. Other columns on bottom right;
- Cummulative, – Calculating total over time for selected field,
- Replicate, – If set value from summary task comes to detailed task and assignments
- Distribute, – described above.
Selected fields are added to Excel\PowerBI data tables and can be used in report visualization parts.
NOTE: Do not delete any of existing fields from selection list even if you do not use them in report. Most of them are used in Power Pivot model and deleting may lead to errors.
Practice
- Click ‘Edit’ or ‘Advance options’ on report you would like to configure
- Select ‘Columns and Formulas’ tab
- Select and add desirable fields to selection list. Some none-editable MS Project fields are not listed, please check ‘Show calculated read only fields’ to get full field list
- Click OK.
- Click Publish. Wait till Excel opens and refreshes
- Find added fields in Pivots and Charts field lists.
3. Total rebuild
That is for Geeks and Experts who are familiar with Power Pivot models and DAX language. You can go inside Model, create and\or modify anything you want. To open Model you need Power Pivot add-in installed in MS Excel. The following button appears on Excel ribbon.
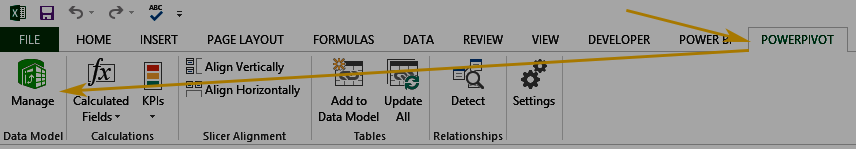
There are no hidden parts, everything is opened for understanding and modification.
NOTE; DAX is not easy language to quickly get in. You have to reserve some time to learn and play with it.
No Comments