02 Apr 1. Reports Overview
CP-Report engine substantially extends MS Project report’s capabilities allowing you to analyze your project data in Excel Pivots\Charts and Power BI visualizations (see highlights …). Modern Excel and Power BI provides attractive and easy to use functionality to visualize and analyze project data from many perspectives. Main advantages are the following:
- Great visualization, drilling down, grouping, filtering and other BI features available for project analysis
- Flexibility and openness allows to design any KPI, analytics and other calculations using Power Pivot model and DAX equations. Everything is opened for modifications.
- Keeping all actual project data in one ‘self-sufficient’ object – Excel and\or PowerBI file which keep all interactive alive. No connection to data source needed.
- Easy publishing on Internet resources
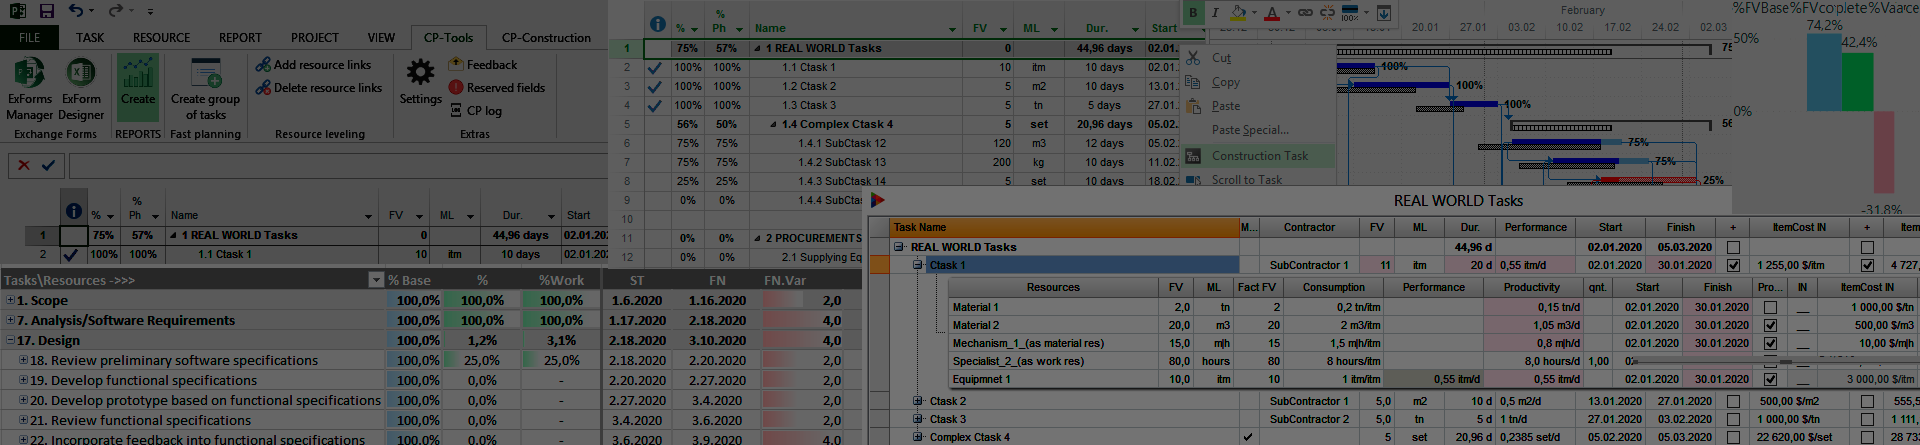
Click ![]() button on CP-Tools ribbon tab to build report from preconfigured samples. Use ‘Report’ sample to build report for typical project and ‘CP-Report’ for project with Advanced CP-tasks (C-Projects). ‘CP-Report’ appears in report list after loading Demo Project from Start Page on CP-Construction ribbon tab. See ‘how to use’ manuals here:
button on CP-Tools ribbon tab to build report from preconfigured samples. Use ‘Report’ sample to build report for typical project and ‘CP-Report’ for project with Advanced CP-tasks (C-Projects). ‘CP-Report’ appears in report list after loading Demo Project from Start Page on CP-Construction ribbon tab. See ‘how to use’ manuals here:
No Comments